

p-hacking: How to Make Almost Any Study Look “Significant”
Why researchers sometimes keep rolling the statistical dice until something “significant” comes up — and what that means for the science you read.

If you’ve ever skimmed a health headline, browsed a nutrition blog, or glanced at the results section of a scientific paper, you’ve probably seen the magic phrase: “statistically significant” or p < 0.05.
It’s often treated as a badge of truth — a sign that something “real” was found, not just a fluke.
But here’s the catch: that little number can be more the product of trial, error, and selective reporting than actual discovery.
Welcome to p-hacking — the practice of running multiple analyses, trying different statistical models, and only reporting the one that crosses the magical threshold. In other words, the “finding” you read about might be the ninth attempt, not the first.
🧪 What Does p < 0.05 Actually Mean?
A p-value is a way of asking: If there’s really no true effect, how likely is it that I’d get results this extreme just by chance?
A p-value of 0.05 means there’s about a 5% probability of seeing results at least as extreme as the ones you got — purely from random variation — if the null hypothesis (no real effect) is true.
If you REALLY want to get technical, check out
’s discussion on how there are multiple different interpretations of what a p-value really is.So if you run a single, clean test and get p < 0.05, you’ve got a statistically significant finding. But if you run twenty different analyses, you’re likely to get a significant finding just by chance alone. When the researcher report only the one analysis with p = 0.041, that number loses its meaning. That “significance” is mostly an illusion.
🔁 The Hidden Drafts Behind “Significant” Results
Here’s where it gets tricky — and where many readers (and even some scientists) miss what’s happening.
Behind every polished, published result, there may be dozens of abandoned analyses. The first run might miss p < 0.05, so the researcher tweaks the model, tests a different subgroup, changes covariates, or drops “outlier” participants. Repeat the process enough times, and eventually something slips under the magical threshold.
That’s p-hacking — reworking the analysis in multiple ways until statistical significance appears. The dead-end versions never see daylight.
P-hacking is just one member of the scientific illusionist’s toolkit. Other crowd-pleasers include selective reporting (only showing the “interesting” results) and outcome switching (changing the goal after the fact so it looks like you hit it).
We ultimately only see the “winning” result: the figure in the paper, the headline, the tweet. But as with a slot machine, pull the statistical lever enough times and it will eventually pay out.
🎲 Why p-Hacking Is So Tempting
P-hacking isn’t always born from malice. More often, it’s a mix of curiosity, ambition, and the very real pressure to publish.
Imagine you test whether a supplement improves memory. The main analysis says: nope, no effect. But then you wonder — what about women only? What about people over 60? What if we drop the two participants who’d had COVID a month before the study? After enough tries, something crosses the finish line at p = 0.048.
Maybe there’s a plausible reason that subgroup responded. Or maybe it’s just statistical noise dressed up as a discovery. The temptation comes when it’s so easy to present that subgroup as if it was the plan all along.
And here’s the thing — p-hacking often works better when paired with its cousins. A researcher might p-hack the data, then selectively report only the successful-looking analysis, or even switch outcomes so it seems like the study’s main prediction was right all along. Used together, these tricks can turn a dull dataset into a headline-ready “breakthrough.”
🍽 The P-Hacking Powerhouse of Food Psychology
The p-hacking methods I’ve described aren’t just hypothetical pitfalls — they’ve been used in the real world to generate studies that seemed solid, scored major media coverage, and landed in prestigious journals.
Few cases illustrate this better than that of Brian Wansink, once one of the most celebrated names in food psychology, whose knack for producing irresistible, statistically “significant” findings eventually unraveled into one of the most notorious research scandals in recent memory.
Wansink was once the media’s favorite food psychologist. His Cornell lab produced irresistible headlines: “Buffet behavior: the science behind pigging out,” “Kids prefer veggies with cool names,” “People eat less if you move the candy bowl six feet away.” The studies were quirky, intuitive, and — most importantly — statistically significant.
Wansink wasn’t operating on the fringes. His work appeared in some of the world’s top medical journals — JAMA, JAMA Internal Medicine, and JAMA Pediatrics. Articles like “Watch What You Eat: Action-Related Television Content Increases Food Intake” and “Preordering School Lunch Encourages Better Food Choices by Children” were tailor-made for media coverage: simple takeaways, clear public-health relevance, and an easy narrative hook.
But beneath the surface was a kitchen full of cooked data.
In a November 2016 blog post, Wansink casually described encouraging a grad student to re-analyze a dataset until something significant popped out — a confession of p-hacking. The screencap of the blog is below:
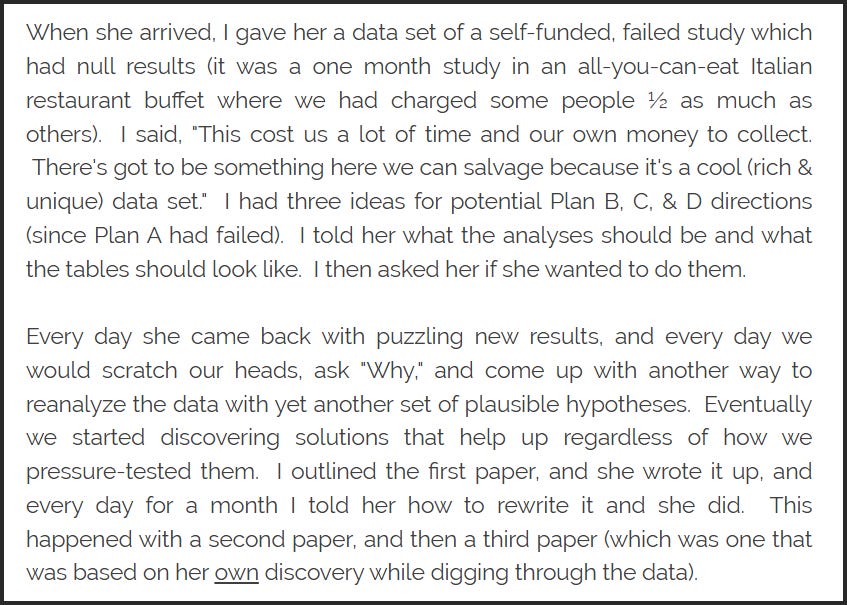
In other words, his lab invested a lot of time and money into data collection, but didn’t find anything interesting. So, he decided to do more analyses. And more. And keep doing analyses until something interesting came up. Eventually, interesting findings did emerge.
That was just the appetizer. Over time, researchers uncovered widespread issues: reuse of data across multiple papers, contradictory results, suspicious patterns, and impossible statistics. Many of his findings were based on slicing datasets every which way until the desired outcome emerged — a classic p-hacking buffet. (And for those familiar with research issues, I really wanted to add the research lingo of “salami slicing” here, but we’ll save that for a future post!).
Wansink’s reputation unraveled. He resigned from Cornell, dozens of his papers were retracted. At the time of this post, Retraction Watch lists 40 papers of his that were retracted. The lesson? Even top-tier institutions, charismatic scientists, and prestigious journals can fall into the trap of overcooked statistics when novelty is rewarded over rigor.
Perhaps the most sobering part: no one knew he was p-hacking until he admitted it himself. Only then did the rest of the problems surface.
🍕The Secret Sauce Behind the Pizza Papers
The full story of the Wansink case is far deeper than I’ll cover here, but it’s worth diving into. For those who want the complete picture, I highly recommend the excellent investigative piece by
— a detailed account that peels back the layers on how these studies were produced.As a preview, a few quotes from Wansink himself make it clear that this wasn’t accidental sloppiness, but a deliberate strategy. One memorable admission:
“I don’t think I’ve ever done an interesting study where the data ‘came out’ the first time I looked at it.”
In another account, a collaborator recalled running over 400 analyses in attempt to find a desirable result!
For an equally fascinating — and sharply critical — take, see Nick Brown’s meticulous dissection of Wansink’s now-infamous “pizza papers.” His analysis, conducted with surgical precision, coined the unforgettable phrase “statistical heartburn.” It’s a masterclass in how to spot — and dismantle — overcooked research.
🧩 Why This Matters
This isn’t just a problem for academics — the public gets stuck with the aftermath. We hear about an exciting new study and start making decisions based on it. Then another study comes along with conflicting findings, and it feels like science can’t make up its mind.
The real problem isn’t indecision — it’s that many studies are optimized for publishability, not reliability. That leaves us overwhelmed, confused, and more likely to trust only the results we want to believe (hello, confirmation bias). I’d much rather see a headline saying dark chocolate is good for me than one suggesting the original claim was bogus.
Once a result is published, it carries the authority of “being in the literature.” But what you’re reading might be the single analysis that happened to “work,” not the one that was planned from the start. And when those results eventually unravel, it’s not just the researchers’ credibility that suffers — it chips away at public trust in science itself.
🧼 What Does Honest Science Look Like?
The good news? We can fix this. Or at least, make it harder to game the system.
Pre-registration. Researchers declare their hypotheses, sample sizes, and analysis plans in advance. If they deviate, they have to say so. And, because it’s public record, we can find out if they changed their plan.
Transparency. Journals should require disclosure of all analyses run — not just the final version.
Valuing null results. Science advances just as much when we find out what doesn’t work. While statisitcally significant results may be more interesting, there is just as much value in knowing when something is not significant.
Contextual reporting. When a finding comes from subgroup analysis or multiple comparisons, say so clearly. No cherry-picking. The subgroup finding may indeed be valuable, but we need to know the context behind that.
🧠 TL;DR: Don’t Trust the First “p” You See
If p-hacking had a motto, it would be:
“If at first you don’t succeed, try 17 more models and publish the one that does.”
Next time you see “statistically significant” results, pause. Ask:
Was this the first test?
Was this analysis pre-registered?
Were other tests reported?
Is this a real effect — or a statistical ghost?
Because the truth is, statistical significance isn’t a verdict. It’s just a probability. And if we torture the data long enough, it will confess.
Seen a study that made you raise an eyebrow? Or a “life hack” that turned out to be a “p-hack”? Tell me about it in the comments — the stranger, the better.
Great post. I did a study once for a company and when we analyzed the data the product "didn't work". When I reported our findings to the company - they were not happy and asked me to go back and find something significant. I said that I likely would find something significant if I went back into the data searching - but that is not what I do. I gave them the data and said that my job was done. And unfortunately for them the product didn't work. I thought I would never hear back from that company but they called me about 2 weeks later and thanked me. They said they had time to think about everything and they realized they got the formula wrong. So they pulled the product before it went to market. And they said I saved them a lot of money in the end. Truth and integrity matter.
Thanks for the reminder of the value(less) nature of p-value out of context and analysis. Good research is about asking a great question, defining the hypothesis ahead of time and being transparent about appropriate deviations! Keep these articles coming.